
Applying gambling theory to investing in practice
How to think like a mathematician when investing in stocks


This is a post for the math nerds. There are a lot of theories on how to invest in stocks. Here are a few of them: Efficient market hypothesis. Fama-french. Arbitrage. Modern portfolio theory. Buy and hold. Contrarian investing. Dollar cost averaging. Fundamentals investing. Technical analysis. Probably too much time and energy has been spent in analyzing markets, but that is a post for another day.
Investing itself is a simple concept that has infinite depth. As an investor, I put money to work by “buying” a share of an asset. This asset can be a share of a company, a share of a bond, or a piece of real estate. Investing only makes sense if I can get more money out than you put in. That’s the game. So to get a good return, I need to predict how much money I’m going to get, how long it will take, and how sure I am. I need to do this every time there is new information. I must re-price the asset, and decide whether I want to stay still, buy, or sell.
Doing this well is very difficult. On average, individual investors do significantly worse than buying an S&P 500 index fund. A big reason is that we are heavily influenced by the opinions of others. As Warren Buffett shares, “Investing is not a game where the guy with the 160 IQ beats the guy with the 130 IQ. Once you have ordinary intelligence, what you need is the temperament.” And the biggest influence of all is the current price of the company. If it goes up, we think it will continue to go up. If it goes down, we can’t help but think it will continue to go down.
This post is my attempt to synthesize the different philosophies of investing and put them into actual practice. I’ll share my approach on how I use these theories in my own portfolio.
We’re going to explore the following levels in detail:
Level 0: Why index funds work
Level I: Applying gambling theory to investing
Level II: Applying the math of gambling to investing
Level III: Using rebalancing and the Kelly Criterion together
Level IV: Evaluating companies and securities
Level V: Evaluating leadership
Level VI: Investing like a stoic
If you’d like to jump to the key takeaways, scroll to the bottom of this post!
Level 0: Why index funds work
When you invest in an index fund, you are usually buying a large basket of companies. This could be the S&P 500, or the Russell 1000 for US based companies. Some of these index funds have a specific tilt, such as investing in technology companies. But the index does not stay the same over time. As stocks go up or down in value, the index fund needs to decide what to do. Most index funds are market-cap weighted. They buy companies that go up in value, and sell those that go down in value to reach specific target percentages. When companies lose too much value and no longer qualify to be part of the fund, they exit the basket. This process is called rebalancing. And rebalancing is why index funds work.
In a blog post on breaking the market. The author shows why rebalancing drives returns. You can see an example below. Here is the difference in return for the Dow 30 from 1940 to 2010, based on the level of rebalancing.
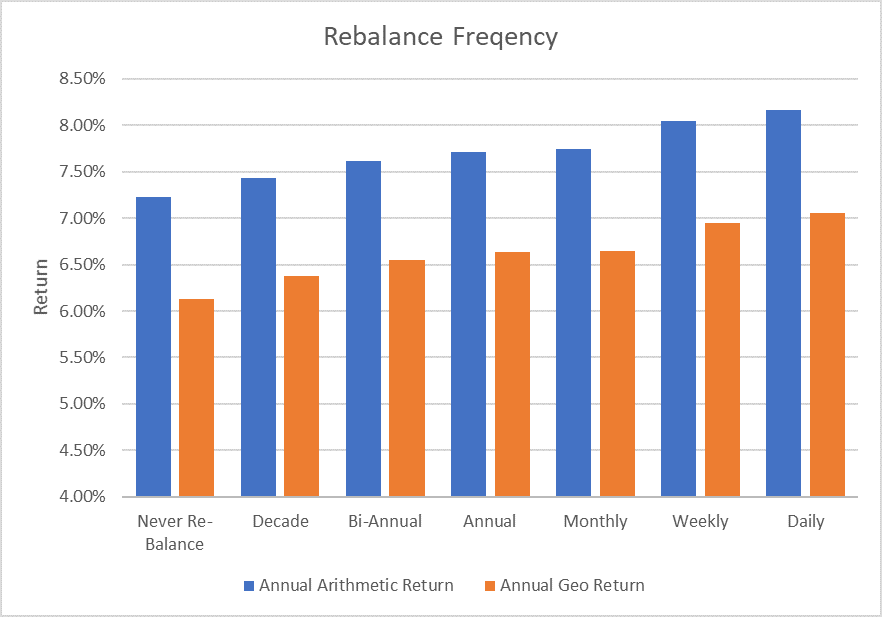
Without diving deep into the proof, a big reason why is that the index is not the stock market. It’s a strategy whose composition changes all the time. It’s not equal to all stocks. It is constantly buying and selling. When an index fund rebalances, it adds new stocks and sells off existing assets to make room. It also exits specific assets entirely. In the investing universe, many individual stocks go to zero, and an index sells these losers before they go to zero. As Warren Buffett acutely says: “The first rule of investing is don’t lose money. The second rule is to never forget the first rule.”
You might be thinking “I get that rebalancing is important for returns. Now what?” This should give you faith that most investors are best suited to buy an index fund and do nothing else. But if we want to reach the next level, let’s see if we can apply different kinds of theories to investing.
Level I: Applying gambling theory to investing
Some of the best investors are also the best gamblers. Annie Duke is a poker champion who wrote the book Thinking in Bets. This book dives deep into decision making and thinking like a poker player. And one of our big fallacies is that we are terrible at separating the quality of a decision from its outcome. Often we see a stock price go up and think the decision was correct, and see a stock price go down and think the decision was wrong. But decisions are bets with imperfect information. Each outcome has a different probability of occurring.
When the outcome does not prove to be favorable, we must update our model and understand why. Sometimes we miss a critical piece of information. Often we explain it as “poor luck.” When we face uncertainty, we take shortcuts and create a narrative in our heads. We fall prey to confirmation bias and motivated reasoning. We try to make new information fit our beliefs, instead of updating our beliefs to fit new information.
So how do we apply decision science to investing? Annie suggests we re-examine our beliefs each time. We need to take inventory of the evidence and understand what we know, what we don’t know, how confident we are, and what the alternatives are.
Answering those questions with any sort of rigor is a whole lot of work! And it’s better to be unsure then to pretend you have conviction. Which is why most investors just invest in index funds. Let’s see if we can dive deeper into the math behind gambling theory.
Level II. Applying the math of gambling to investing
Buying and selling stocks is like making bets at a poker table. Every time you play, you are betting a percentage of your total cash against a particular parlay. And when you lose money, it requires more return to get back to even.
Imagine a bet that goes up by 10% and then falls by 10%. How much are you left with? One percent less than you started with:
110% X 90% = 99%
If you lose 50% of your wealth, it takes a doubling of your wealth to get back to whole.
50% X 200% = 100%
Winning 25% twice outperforms winning 50% once followed by breaking even (0%).
125% X 125% = 156%. 150% X 100% = 150%
This is called the geometric average. Your return on your money goes up or down in value through multiplication, not addition. When you earn 10% in 1 year, the next year will use that 10% to generate more return (or more losses).
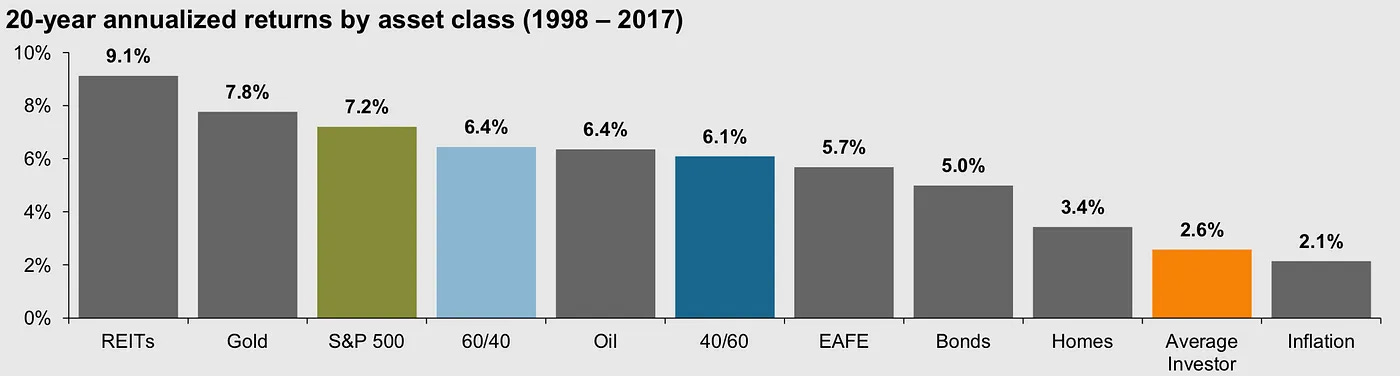
The S&P 500 averaged 5.13% return per year (excluding dividends) over the last 20 years. Yet nobody received that return. Investors actually received the geometric return of 3.63% per year, which is the compound annual growth rate (CAGR).
From breakingthemarket.com:
An extreme example of geometric return is Nassim Taleb’s Russian roulette example. If six people play Russian roulette at the same time, one will likely die. You personally will have an 83% chance of living. If you play all 6 games yourself back to back, I think you can figure out the likely outcome. The arithmetic average deals with the first version of roulette. The geometric average, and all things in life, deal with the second.
How can we use this knowledge of the geometric average to our advantage? The Kelly Criterion is our method. The Kelly Criterion dictates how much to bet based on the expected winnings and the probability of the win.
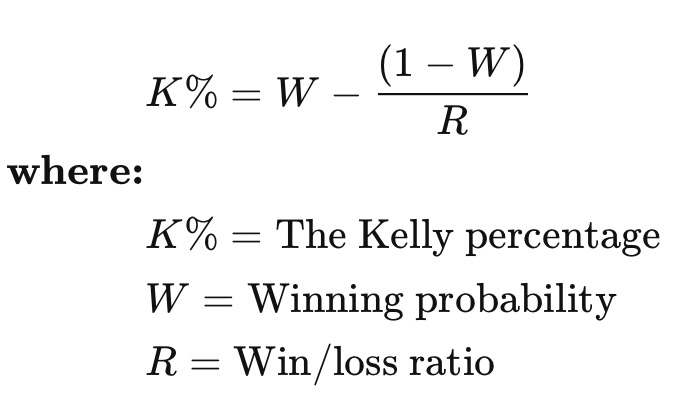
Here’s an example. Let’s say you have a 55% chance of winning, and you would double your money if you win. The Kelly criterion dictates that you should bet 55% - (1 - 55%) / 1 = 10% of your total available. This theory was created because over repeated bets, betting large amounts of money would greatly increase your chances of going to $0.
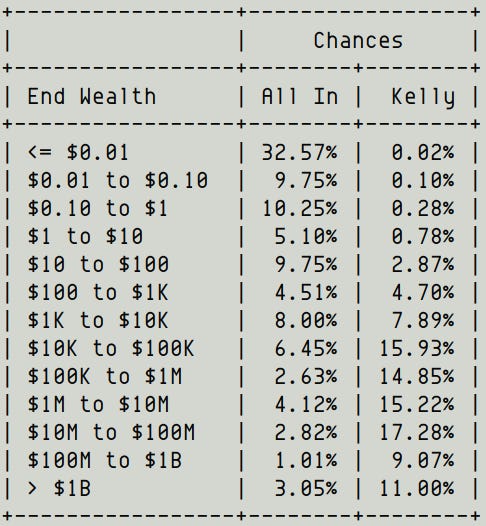
Smarter people than me have shared breakdowns of this on Twitter (thanks @10Kdiver). Imagine you had a pretend stock which doubles or halves in value every month. There's a 50/50 chance of either outcome. You can pursue two strategies. One strategy is you put in 100% and leave it there for 20 years. The other is to put 50% of your assets into the stock, and put 50% in cash. 10K diver ran many simulations and you can see the likely outcomes below. The all in strategy has a 52% chance of losing money, and a 32% chance of going to zero! But the Kelly criterion minimizes that outcome considerably. Why this works is that it makes sure to take chips off the table when you win, so you still have money to put in when you lose.
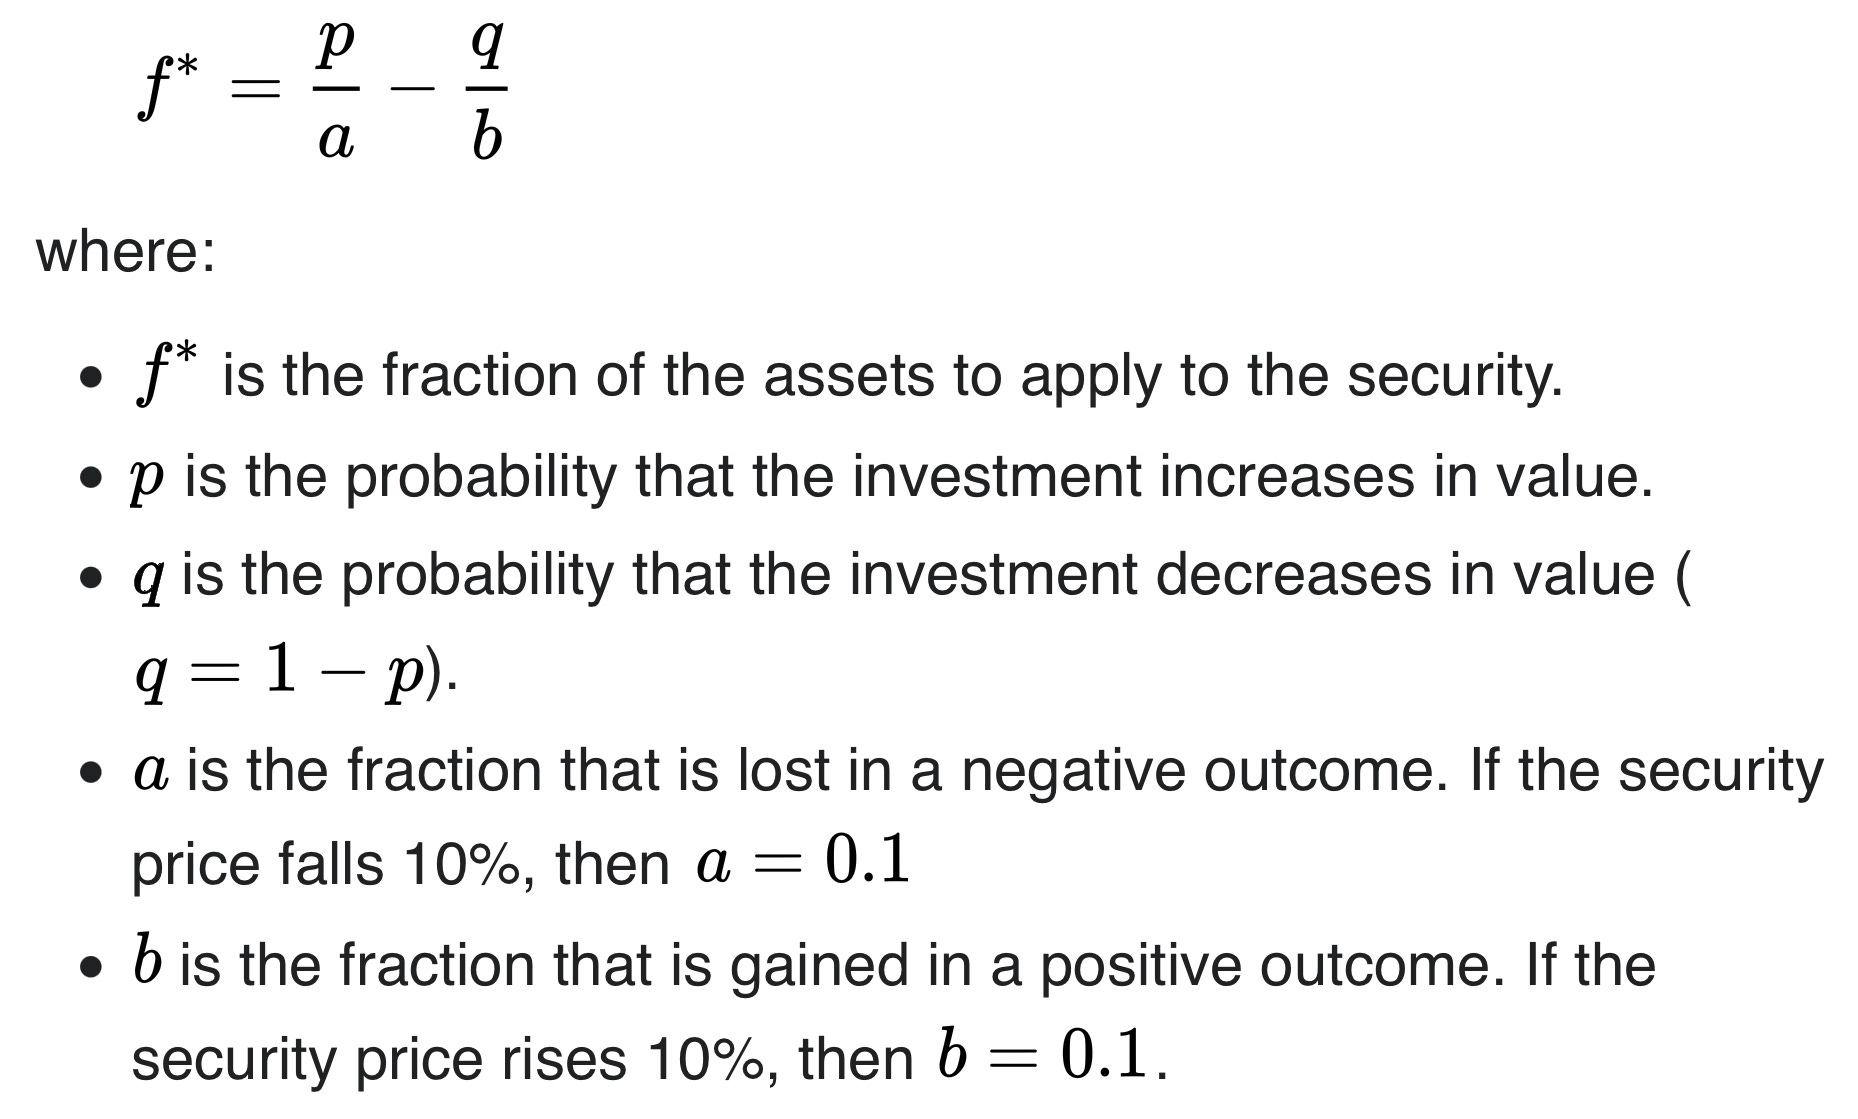
But investments are not all or nothing. Usually public equities never reach $0 before you sell it. You usually have a lot of warning before an investment becomes $0. Straight from the wikipedia page, here’s the definition that allows for partial losses.
I put together the following spreadsheet to do my own application of the Kelly Criterion, using the following arbitrary rules for calculating each variable.
Confidence: this is arbitrary based on how sure I am in the investment thesis. Best to reduce confidence when you are uncertain. I use 30%, 50% and 80% as broad strokes for confidence. Never 0% or 100%.
Max drawdown: this is based on valuation multiples. Since many companies are valued on ludicrous EV to Sales multiples, this logic uses these to determine max drawdown. The theoretical max drawdown for any investment is 100%, but that defeats the purpose of using the Kelly criterion. I used ranges from 10% drawdown to 70% drawdown based on the EV to sales multiple.
Maximum return: this is based on market cap. Bigger companies have a lower ceiling of return, so for extremely large companies, I said the max return is 1.5x. For small companies, the max return is 10x.
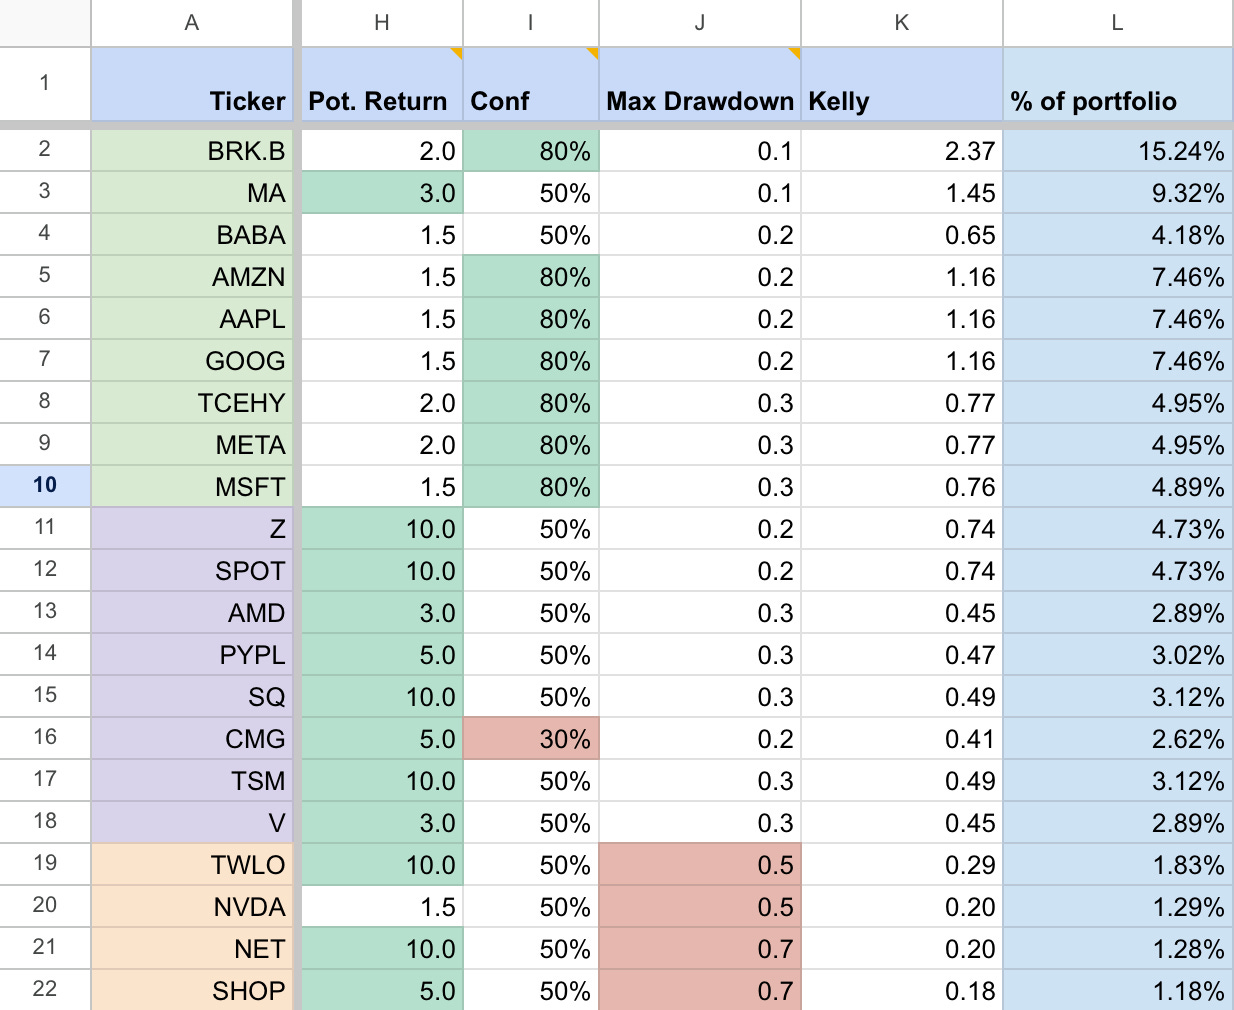
After applying the Kelly criterion to a set of arbitrary tickers, you’ll notice that the Kelly Criterion really prioritizes stocks with higher confidence and lower potential drawdown. It’s best to bet larger amounts on assets with higher certainty, and smaller amounts on assets with higher upside. Don’t bet on anything that has neither. The goal is to avoid losers, but still bet appropriately when there is high upside.
Another conclusion is that the bet size needs to be a certain size for it to mean anything. If it is <1% of assets, then I might as well buy an index fund. This means I need to have some concentration, and focus on buying 10 stocks, not 100.
Let’s see how we can combine the Kelly Criterion, betting theory, and rebalancing together.
Level III. Using rebalancing and kelly criterion together
The beautiful thing about investing today is that so many products are now free for individual investors. Trading costs and research tools now cost almost zero. Robinhood Gold is $5 per month. Every platform offers $0 trades for most securities.
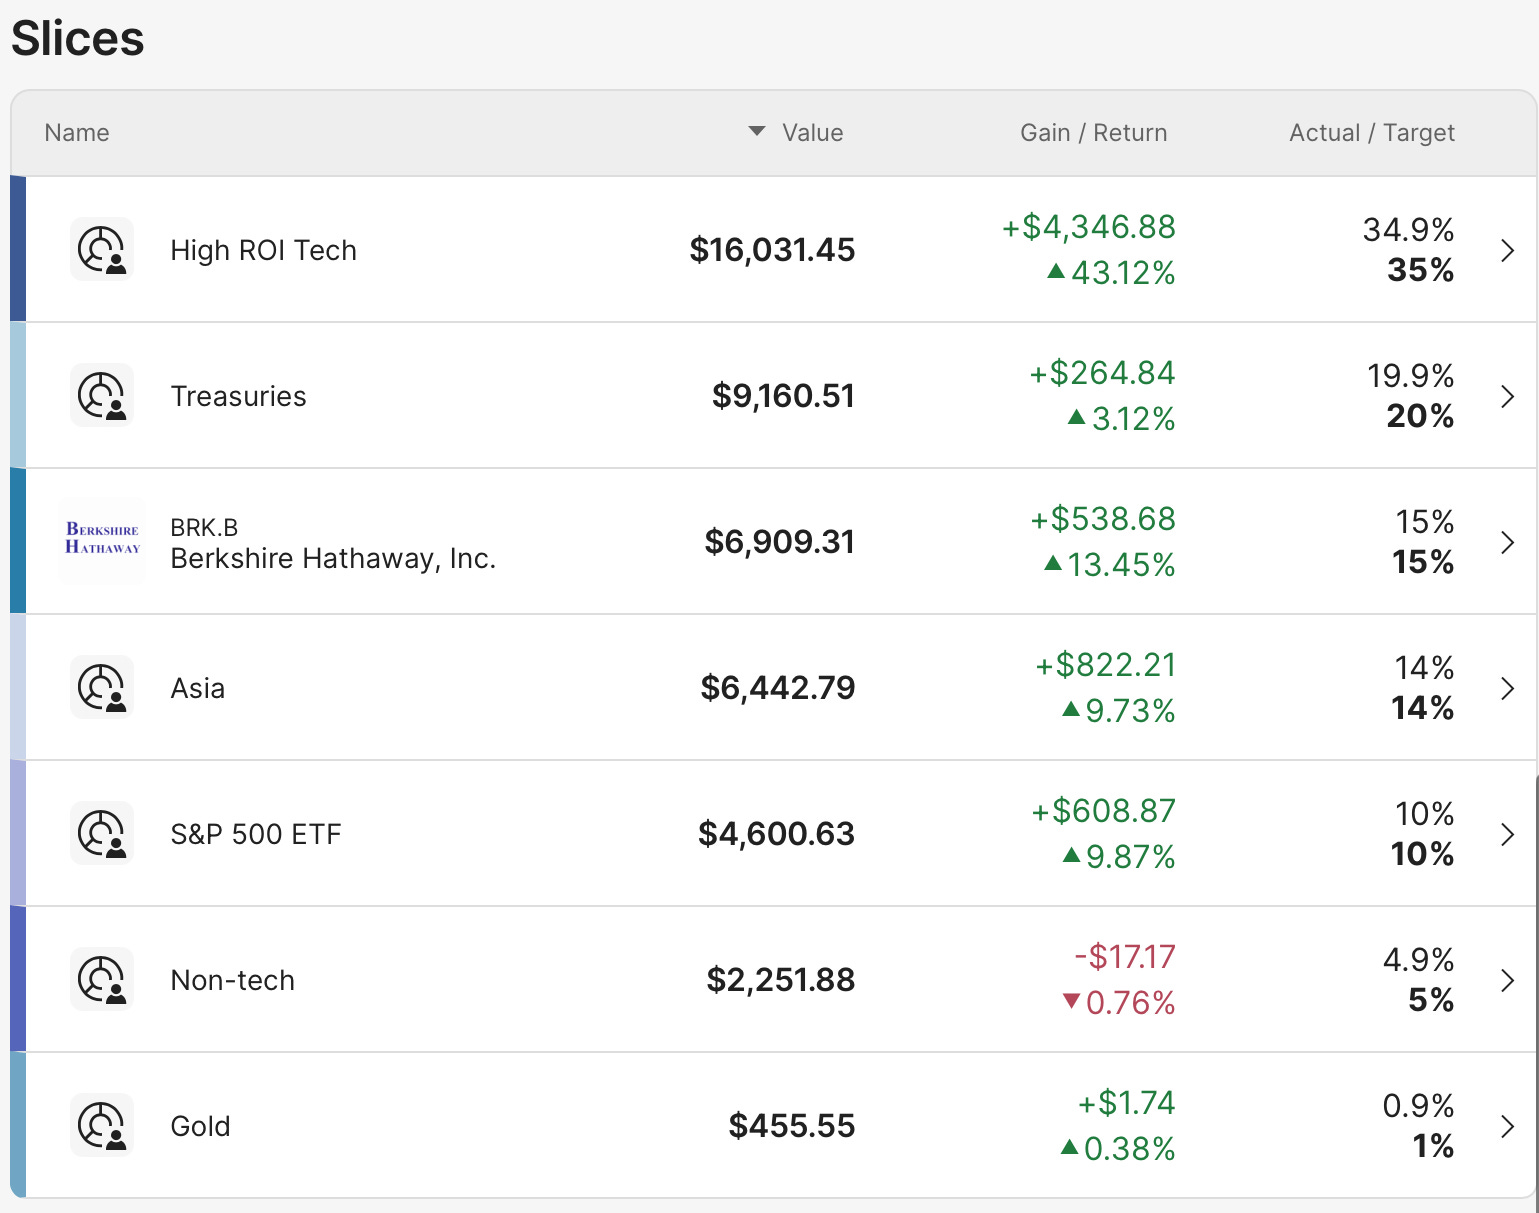
To combine rebalancing and the Kelly Criterion together, we can use a tool called M1 investing. M1 allows you to create buckets of investments and assign percentages to them. As your investments change in value, you can ask the computer to rebalance them for you. You can also change the percentages whenever you want. It seems like such a simple idea, but with simplicity comes tremendous power.
Here’s an example of my portfolio with fake numbers and a link to register, which uses my referral code. But I was not paid to make this post, I just like it.
Here are the benefits:
Rebalancing sells high and buys low. The computer will sell the investments that grew and take chips off the table. The computer will buy the investments that haven’t risen in value yet. And oddly enough, this works even if the asset I’m selling will out-perform the one I’m buying. This is because the volatility drag on a portfolio is truly real.
Both rebalancing and dollar cost averaging remove timing risk. Prices can be extremely volatile. Every time you rebalance or dollar cost average, you get to take advantage of the volatility by selling high and buying low. This is even more powerful if you have uncorrelated assets in the portfolio. You can find out how correlated your assets are by using this tool.
Rebalancing gets rid of the emotional attachment to your winners. If a stock starts at $100, goes up to $500, and then goes back down to $100, you get no returns from buy and hold. Rebalancing gives it to you.
% of assets simplifies how much money to use when buying or selling. For example, if I want to make a bigger bet in Apple, I can’t just summon $20k from nowhere. I have to take it from something else. And which investments should I take it from? How much should I sell? Why? Often I turned to nice round numbers like 100 shares or $5,000 only because they look nice.
I love it when I do a whole bunch of due diligence after getting new information, and then I don’t make any changes to the percentages. That’s when I feel like it’s really working.
So now we know how to create % investment allocations, map them to our bets, and rebalance them frequently over time. But how do we know which securities to put in the basket? Time for the next level!
Level IV: Evaluating companies and securities
My friend recently asked me the following over a text message:
I work in data and I think that snowflake is a dope product and I can see it getting better with time. I can also see the situation where normie companies are going to be using Snowflake eventually. Do I put money in, irregardless of where Snowflake currently is in regards to EV/EBIDTA?
It’s easy to think good companies mean good stocks. And this is where I lean on Howard Marks, “It’s not what you buy, it’s what you pay.” There is always a price where a good company is too expensive, and a price where a bad company is too cheap.
A few years ago, a service called Moviepass sold unlimited $10 movie tickets for $10 per month. The business was selling dollars for cents, which makes it a worthless business. However, imagine you could buy the entirety of this business for one cent. Even if it was the worst company in the universe, Moviepass investors could still receive return. The company could be stripped for parts and sold for value. If this exceeds what they owe creditors, investors get return, making it a good investment. First-level thinking says, “It’s a good company; let’s buy the stock.” Second-level thinking says, “It’s a good company, but everyone thinks it’s a great company, and it’s not. So the stock’s overrated and overpriced; let’s sell.”
Let’s revisit the framework from the introduction. Investing is about getting more money out than I put in. So to get a good return, I need to:
predict how much money I’m going to get — as a shareholder, I want to get money out for putting money in. Businesses give this back to shareholders as dividends (and sometimes buybacks). And the dividend also increases over time as earnings goes up. A simplified equation is
return = dividend yield + earnings growth. To analyze this, does the return for this individual security exceed the yield I would receive from treasuries or bonds, which are lower risk? When I buy treasuries now, I am guaranteed 5% return. So what is my belief that a stock will eventually give me more than that 5% by earning more future money?how long it will take — this is my discount rate. Future money is worth less than current money. A big part of getting a prediction right is nailing the time frame of the prediction.
how sure I am — this is my confidence in the outcome expressed as a probability, and I need to account for uncertainty.
As businesses grow and mature, they eventually trade at a normal market multiple of cash flows or earnings (e.g.12.5x FCF or 15x P/E ratio). This is equivalent to 8% FCF yield. What do I have to assume about the company for it to get to my target valuation?
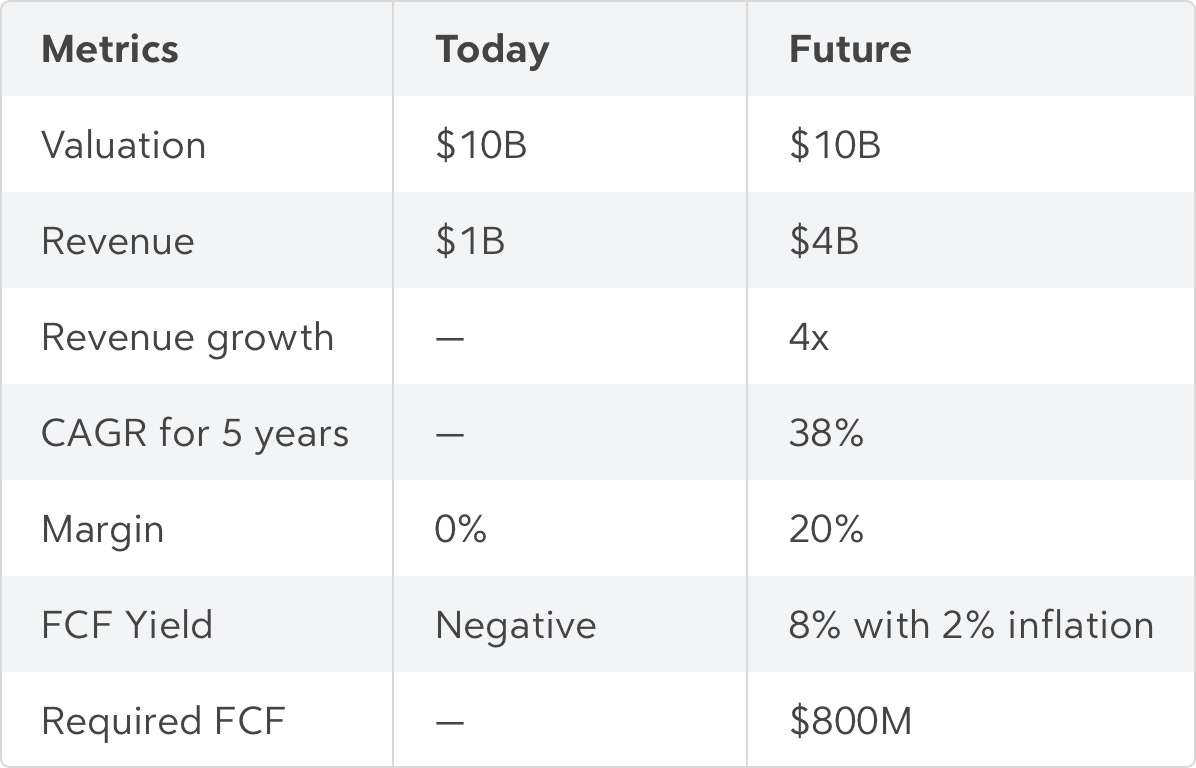
Here’s an example chart I made about Cloudflare (NET). For simplicity, I’m using round numbers for the valuation and revenue. $10B EV for $1B in annual revenue. For 0% return, what do I have to assume for the business to grow into a valuation that matches 8% FCF yield? 8% of $10B is $800M in FCF. Assuming 20% FCF margin, which is extremely generous, that requires $4B in revenue. That means the business must become insanely profitable AND it must 4x in revenue for the company to grow into the same valuation number. Over 5 years, that is a CAGR of 38%. There is a lot of optimism factored into the price, which could make it a poor investment — unless you had evidence and belief that the company could grow well past 38% CAGR for more than 5 years.
The beautiful thing about this framework is that it makes you write down your assumptions. It does not require a discount FCF excel spreadsheet, or complex mathematical modeling with false precision.
The way I simplify this for myself is to buy long term upside I don’t have to pay for. If there’s a wonderful company trading at 15x P/E or 7% cashflow yield, it’s likely going to be a great deal.
This section primarily focused on valuation multiples and it did not talk about business drivers. How might you choose a company to invest in based on the actual economics of the business? Time for level V!
Level V. Evaluating leadership
When you make an investment in a company, you are really making an investment in its leadership team. And how do you know whether a leadership team is doing well as a public equity investor? Every leadership team will say they are doing a good job during their earnings calls. It’s up to us to sniff out the real from the baloney.
Chuck Akre uses the metaphor of the three legged stool, where he looks for companies who have all three legs before making an investment. The three legs are great businesses, people, and reinvestment potential. Let’s explore each one.
A great business is a profitable business. If the leadership team is managing the business well, profits will be high. Imagine a literal money printer. In comes investment dollars, out comes double the dollars as profits over a long period of time. The best signal of this for a mature company is high FCF yield, because the share price is low based on the FCF.
A great company requires great people. What is a company’s glassdoor rating? Does management take care of their employees? Has the leadership team ever lied? Don’t bet on dishonest people. Great leaders are also great partners and stewards of capital. They treat their shareholders well. They don’t embezzle funds to spend lavishly for their own benefit. They are usually reducing the share count instead of increasing the share count.
A company with great reinvestment potential has a bright future ahead. They bet on rising technology and market trends, not declining ones. It has the opportunity to reinvest further dollars into business expansion at high rates of return. Often times we mistake past performance for future reinvestment potential. New store openings could do poorly even when existing stores are doing well. There are a few ways a company can expand:
Expand geographies — for example, this would be expanding from the US to the UK.
Offer new segmentation — instead of one product line that serves a particular type of customer, offer several across multiple prices to attempt to serve a wider audience.
Upsell existing customers — create new offerings or services which increase willingness to pay or deepens the customer relationship for existing customers
Create new product lines — create brand new products and services from your existing resources to expand the addressable market of the business.
Expand to a new distribution channel — figure out a different way to acquire customers, which increases sales of existing products.
Many of these expansions are dependent on a company’s playbook and leadership position. Have they shown evidence that they’ve been able to expand to new geos or segments well before? Have they demonstrated pricing power? What is their differentiator that is hard to replicate? An under-appreciated attribute of great leadership is speed and quality of execution. Great teams do a lot with a little, and they do it quickly.
In Expectations Investing by Michael Mauboussin, he maps out a way to value what he calls “real options.” These are unique expansion opportunities that outline the discrepancy in a company’s stock price. An example of this could be Square’s cash app, or Spotify’s expansion into podcasting, or Apple’s Vision Pro product line. Square’s valuation has embedded the potential future growth prospects of Square’s cash app to create market value, rising expectations and also elevating the price. When investors believe in a company’s future growth prospects, they believe that they will materialize from these real options.
To summarize, investors need to exercise judgment over a company’s leadership and growth prospects. Let’s graduate to the final level.
Level VI. Investing like a stoic

This final level is about handling our emotions. This is where temperament comes into play. Every investor is playing a different game. There are hedge funds on wall street, algorithmic traders, mom and pops, and passive ETFs. Every investor is optimizing for something different. My goal is to maximize my return, avoid catastrophic loss, and sleep at night. I think I have an edge because I’m willing to put in the work, I have unique exposure to how technology and design affects adoption, and I can combine that with business knowledge to form a unique point of view.
But it is all for naught if I fall prey to my emotions and sell when other people are selling. We’re wired to follow others. We can’t help but listen. Joel Greenblatt, a Columbia professor, brought a big jar of jelly beans and asked 9th graders to guess the number of jelly beans in the jar. The first guess was written on index cards and then submitted individually. He went around the room a second time, asking them to say their guess aloud to the class. And then they could choose to keep their guess or change it.
The total number of jelly beans in the jar was 1,776. The average of the first guess, written on the cards, was 1,771 jelly beans. But the average of the second guess, when he went around the room, was only 850 jelly beans.
From Joel Greenblatt:
I explained to them, the stock market is actually the second guess. Okay? Because everyone knows what they just read in the paper or what the guy next to them said or what’s on the news and are influenced by everything around them. And that was the second guess and that’s the stock market.
From Howard Marks, the Most Important Thing:
Investing isn’t like economics. Many people tend to fall further in love with the thing they’ve bought as its price rises, since they feel validated, and they like it less as the price falls, when they begin to doubt their decision to buy.
Investors with no knowledge of (or concern for) profits, dividends, valuation or the conduct of business simply cannot possess the resolve needed to do the right thing at the right time. With every- one around them buying and making money, they can’t know when a stock is too high and therefore resist joining in. And with a market in freefall, they can’t possibly have the confidence needed to hold or buy at severely reduced prices.
If you liked it at 60, you should like it more at 50 . . . and much more at 40 and 30. But it’s not that easy. No one’s comfortable with losses, and eventually any human will wonder, “Maybe it’s not me who’s right. Maybe it’s the market.” The danger is maximized when they start to think, “It’s down so much, I’d better get out before it goes to zero.” That’s the kind of thinking that makes bottoms . . . and causes people to sell there.
Investing is a popularity contest, and the most dangerous thing is to buy something at the peak of its popularity. At that point, all favorable facts and opinions are already factored into its price, and no new buyers are left to emerge.
The safest and most potentially profitable thing is to buy something when no one likes it. Given time, its popularity, and thus its price, can only go one way: up.
This is where a willingness to know when you’re wrong (AND when you’re right) is extremely important. Price drives narrative. High prices make people talk about the company as if it’s the best thing ever. Low prices cause people to trash the company on Twitter and social media platforms. And the most important factor is how much optimism is factored into the price. Skepticism calls for pessimism when optimism is excessive. But it also calls for optimism when pessimism is excessive. Be aggressive during extreme pessimism, and be defensive during extreme optimism.
There will always be opportunities because people will continue to do dumb things. Think Gamestop, Bed Bath and Beyond, Luna, Terra, Crypto, NFTs, SPACs. There have been so many instances of stocks that were attempts to take advantage of other people’s greed, and then take their money away from them. The idea here is to instead wait for the discount in great companies and take a position when most people are doubters.
Remember, there are no extra points for the difficulty of your forecast or valuation. Simple investments are good. Lots of diligence plus poor judgment can lead to terrible outcomes. You only need a few winners. You don’t need to hold every company. Concentrate where it’s safe and wise. Avoid the losers, and the winners will take care of themselves.
And prepare to be wrong. Rebalancing, fundamentals analysis, dollar cost averaging, and bet sizing helps us account for risk, error, and uncertainty. The stock market does not care about our feelings. Protect yourself from catastrophic risk of going to zero. Zero multiplied by any return will still equal zero, and some bets WILL go to zero.
Key Takeaways
If you read this far, you are a gem and I appreciate you for reading! Here are 10 key takeaways across all of the levels:
Level 0: The game of investing to get more money out than I put in.
Level I: Index funds work because rebalancing buys low and sells high. Rebalancing takes advantage of volatility, and exits positions that fall too low.
Level II: Investing is like making bets at a poker table. We must re-examine our beliefs every time we receive new information.
Level II: The first rule of investing is don’t lose money. Avoid losers.
Level II: Investing is not addition, it is multiplication. We don’t get to play again if we go to zero, no matter how much we won beforehand.
Level III: Let the computers do the work. You decide the percentages, and let the computer decide which assets to buy and sell.
Level IV: Buy long term upside you don’t have to pay for. If there’s a wonderful company trading at 15x P/E or 7% cashflow yield, it’s likely going to be a great deal.
Level V: Look for companies with great businesses, people, and reinvestment opportunities.
Level VI: Be aggressive during extreme pessimism, and be defensive during extreme optimism. The safest and most potentially profitable thing is to buy something when no one likes it.
Level VI: Prepare to be wrong and protect yourself from catastrophic risk of going to zero.
If you enjoyed this piece, please share it with others and subscribe!